Average Employee Tenure
Average Employee Tenure - HR Metric - calculation
What (Definition)
Average Tenure measures the average of tenures of all employees in the company. A tenure is defined as the duration of employment (from start date to today) of an employee.
If an employee started working at the company on Jan 1, 2020, the employee will complete 31 days of tenure on Jan 31, 2020 and 366 days of tenure on Dec 31, 2020.
Why (Benefits)
Measuring and monitoring the tenure will allow a company to understand their workforce profile mix.
A company would want to retain high performing employees as long as possible. More long-tenured employees in a company would be beneficial to the company. They bring their experience and knowledge of the company policies and processes and are likely to perform tasks more effectively and efficiently.
A growing company will have new employees joining the company. Also, new employees will bring fresh perspectives and solutions. Infusion of new employees will reduce the average tenure.
Each company needs to achieve the right balance between long-tenured experienced employees and new employees with fresh ideas. This balance will vary from one industry to another.
How (Calculation?)
Formula
Tenure in Days = (Current Date – Employee Start Date + 1)
Average Tenure = Average of Tenures calculated for each employee
We have to calculate the tenure first for each employee and then take an average of those tenures.
Average Tenure Calculation with an Example
Tenure and Avg. Tenure are typically displayed as years (example: 3.5 years) or months (example: 42 months).
Tenure can vary by department, business units or by type of job. Hence calculating and monitoring tenure should be done in each department.
Caution:
The downside of aggregating tenure using an ‘average’ is that it can be skewed by small samples and outliers. Let me explain this with examples.
1. Small sample effect
A manager has 2 employees in the team and one is a very experienced (20 years tenure), and another is relatively new (2 year tenure). The average tenure will be 11 years.

Average tenure of small teams can be misleading
When one looks at 11 years as average tenure, one might think that the team is very experienced. However, only one of the employees is long tenured.
If you choose a person from such a team, you might either get very experienced person or very inexperienced person, and not someone with 11 years of tenure.
This scenario can happen when there are smaller teams. Hence, we must always consider the number of employees in the team when evaluating the tenure.
2. Outliers can skew the average
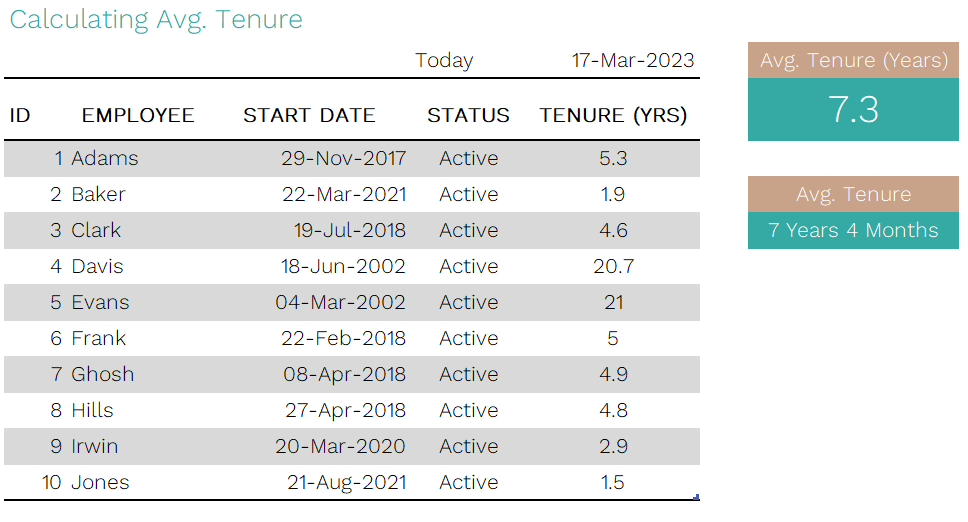
Let’s take an example of 10 employees with 2 of them being very experienced in the company.

Example Employee data with 10 employees
Average tenure in this example is 7.3 years. We can clearly see that only 2 employees have more than 7 years of tenure.
This is how a couple of outlier data points can influence average significantly.
What can we do to address outliers?
Here are some options and the choice depends on the specific action you plan to take using this tenure information.
Use Frequency distributions data to take decisions
This is where we create bins or buckets or categories of tenure, and count frequency of occurrence of each bin. In our example, we can create bins based on years of tenure. Let’s take a look at this chart.
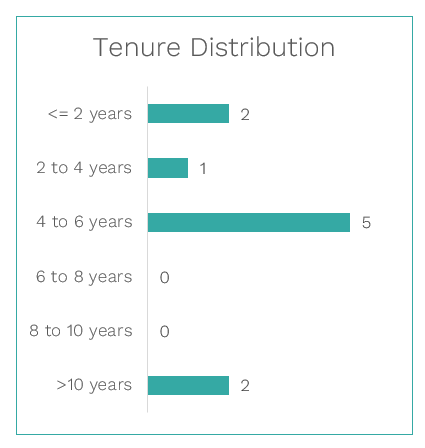
Employee Tenure Distribution
We are now displaying the number of employees in each bin.
For example, there are 5 employees with tenures between 4 and 6 years.
This type of visualization helps understand the concentration of employees in tenure buckets. It also will show any outliers more clearly. Based on this we will not interpret the tenure of the group as more than 7 years which is what the average calculation led us to believe.
Use Median instead of Average
In the same example, if we calculated median tenure, it would have been 4.9 years, which is a better representation of the team members’ tenure.
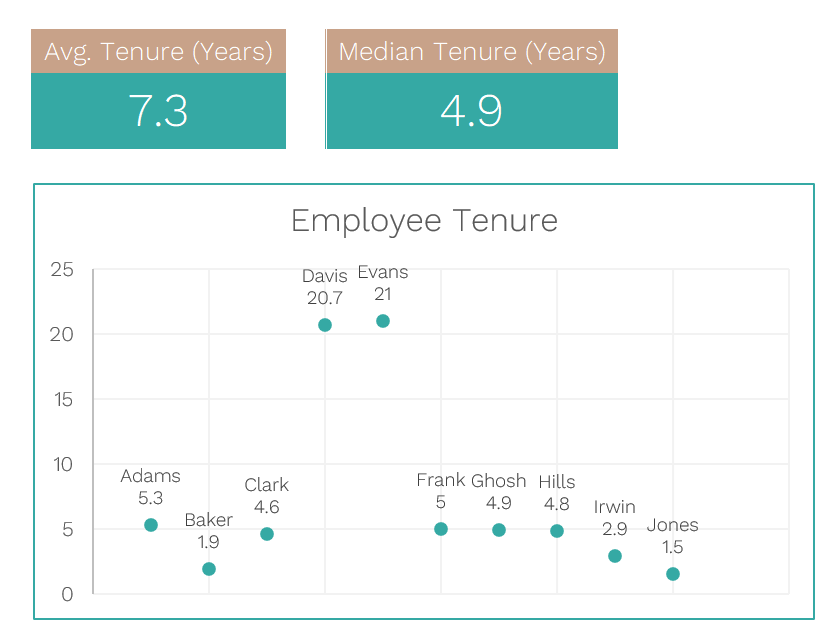
Comparing Median vs Average Employee Tenure calculation
Removing Outliers
If there are only one or very few outliers, remove them while calculating average tenure.

In our example, removing 2 outliers will lead to the average being 3.9 instead of 7.3.
Related HR Metrics

Now, it’s your turn.
How do you measure tenure in your company? Please share your thoughts below. I look forward to learning from you.
What is Employee tenure? Why should we measure tenure? How to calculate average employee tenure?