The Ultimate Guide to Recruitment Reporting
In this article, I will cover the key components of an effective Recruitment Reporting setup.
The following are the major sections covered.
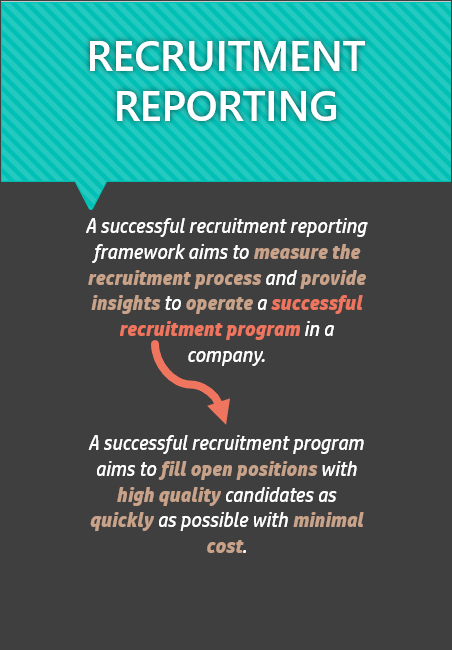
Purpose of Recruitment Reporting
A successful recruitment reporting framework aims to measure the recruitment (talent acquisition) process and provide insights to operate a successful recruitment program in a company.

Recruitment Reporting Framework - HR Reporting Tools
A few important things to note in this are
Measuring the recruitment process is important as we can only improve if we measure the current state.
Just reporting standard numbers out of your HR software is never sufficient and a good reporting platform will allow you to gain insights and take decisions.
Decisions taken should include not only strategic investment decisions, but also day-to-day operational decisions. So, operational reporting should also be part of our framework.
Ultimately all the above should lead to a successful recruitment program.
A successful recruitment process aims to fill open positions with high quality candidates as quickly as possible with minimal cost.

Recruitment Program Objective - HR Reporting Tools
There are 4 key phrases in this definition.
Fill Open Positions
High Quality
Quickly
Minimal cost
Let me explain how these 4 are inter-connected.
The goal of the recruitment program is of course to fill open positions.
However, the candidates hired should be the right fit to the company and role. This is where Quality comes in.
If we have filled open positions with high quality candidates, we can call it a very effective recruitment program. But is it efficient?
Efficiency measures the successful achievement of the tasks/goal using the least possible resources. Here, time and money are the resources.
That is why it is important to fill open positions quickly using minimal cost.
A good recruitment reporting and analysis setup should measure or track all the 4 above-mentioned components and provide insights to optimize them.
This is how our recruitment reporting framework should enable a successful recruitment program.
Recruitment Reporting & Program Objectives
Let’s move to the discussion on Recruitment Metrics.
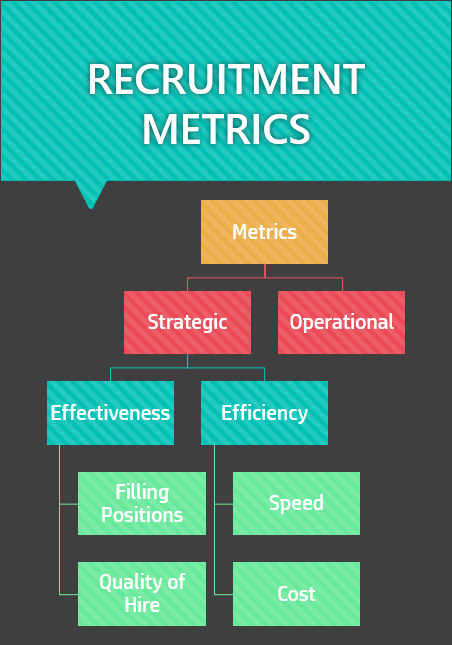
Recruitment Metrics
Let’s start with an overview of different categories of metrics we will be talking about. There are different ways to categorize and organize. Here is one example.
Recruiting Metrics - Overview
There are metrics that allow us to evaluate our recruitment program so that we can improve it strategically. Let’s call them Strategic metrics. Strategic metrics can further be split into ones that focus on effectiveness and those on efficiency. We will discuss these in detail shortly.
On the other hand, there are metrics and reports that allow us to operate day-to-day and execute tasks related to recruitment. Let’s call them Operational Metrics.
We will first discuss Strategic metrics in detail.
Simple Recruitment Metrics
Here is a typical recruitment process lifecycle.
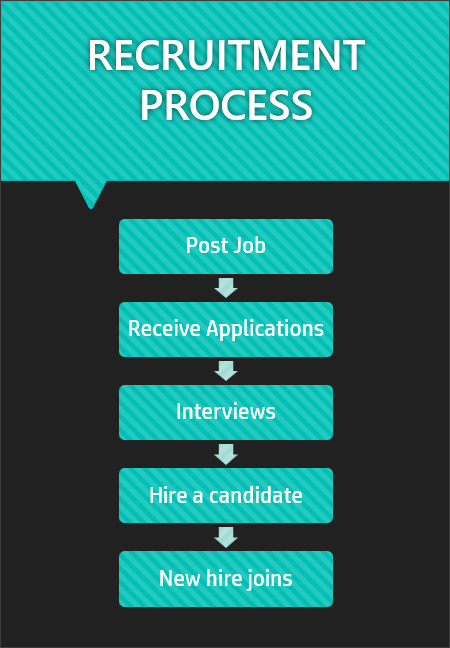
Typical Recruiting Process
To understand the scale of the recruitment program, the following basic metrics will help.
Applications: How many applications did we receive from candidates to our open positions?
Offers: How many candidates did we select and offer a job?
Hires: how many positions did we fill or how many candidates did we hire?
Hiring cost: How much are we spending on recruitment?

Basic Recruiting Metrics
The above are absolute measures or simple metrics. In other words, they are numbers – whole numbers or currency. They should be part of any recruitment reporting and are helpful.
For us to measure the effectiveness and efficiency of our recruitment process, we need to normalize these absolute measures. In other words, we need to convert the simple metrics to compound metrics. Let me explain with an example.
Why do we need Compound metrics?
Let’s take ‘Hires’ metric.
Hires: how many positions did we fill or how many candidates did we hire?
Hires depends on how many jobs are open, how many applications are coming in and the quality of the candidates.
If Hires increased from 5 in July to 7 in August, does that mean our candidate pool has become better in August?
Not necessarily.
If, for July, we selected 5 candidates from 100 applications and for August, we selected 7 candidates from 200 applications.
For July, Conversion % is 5/100 = 5%
For August, Conversion % is 7/200 = 3.5%
If we use Conversion % (Hires/Applications) metric, we get a different picture of our candidate pool. We received more applications in August and the Conversion % is lower.

Why do we need Compound HR Metrics?
Here, Conversion % is a better metric (than Hires) to evaluate the candidate pool as it already considers the number of applications in the denominator. Now the Conversion % can be compared from one month to another.
While Hires is important to measure the output/outcome, the Conversion % measures how effective the recruitment process is.
This is why we need compound metrics in addition to absolute simple output/outcome measures.
Now, let’s look at the compound metrics in detail.
Effectiveness metrics
First, we will talk about the metrics that measure the effectiveness of the recruitment program.
We will be looking at 2 sets of effectiveness metrics – one focused on filling open positions and the other focused on ‘quality’ of hired candidates.

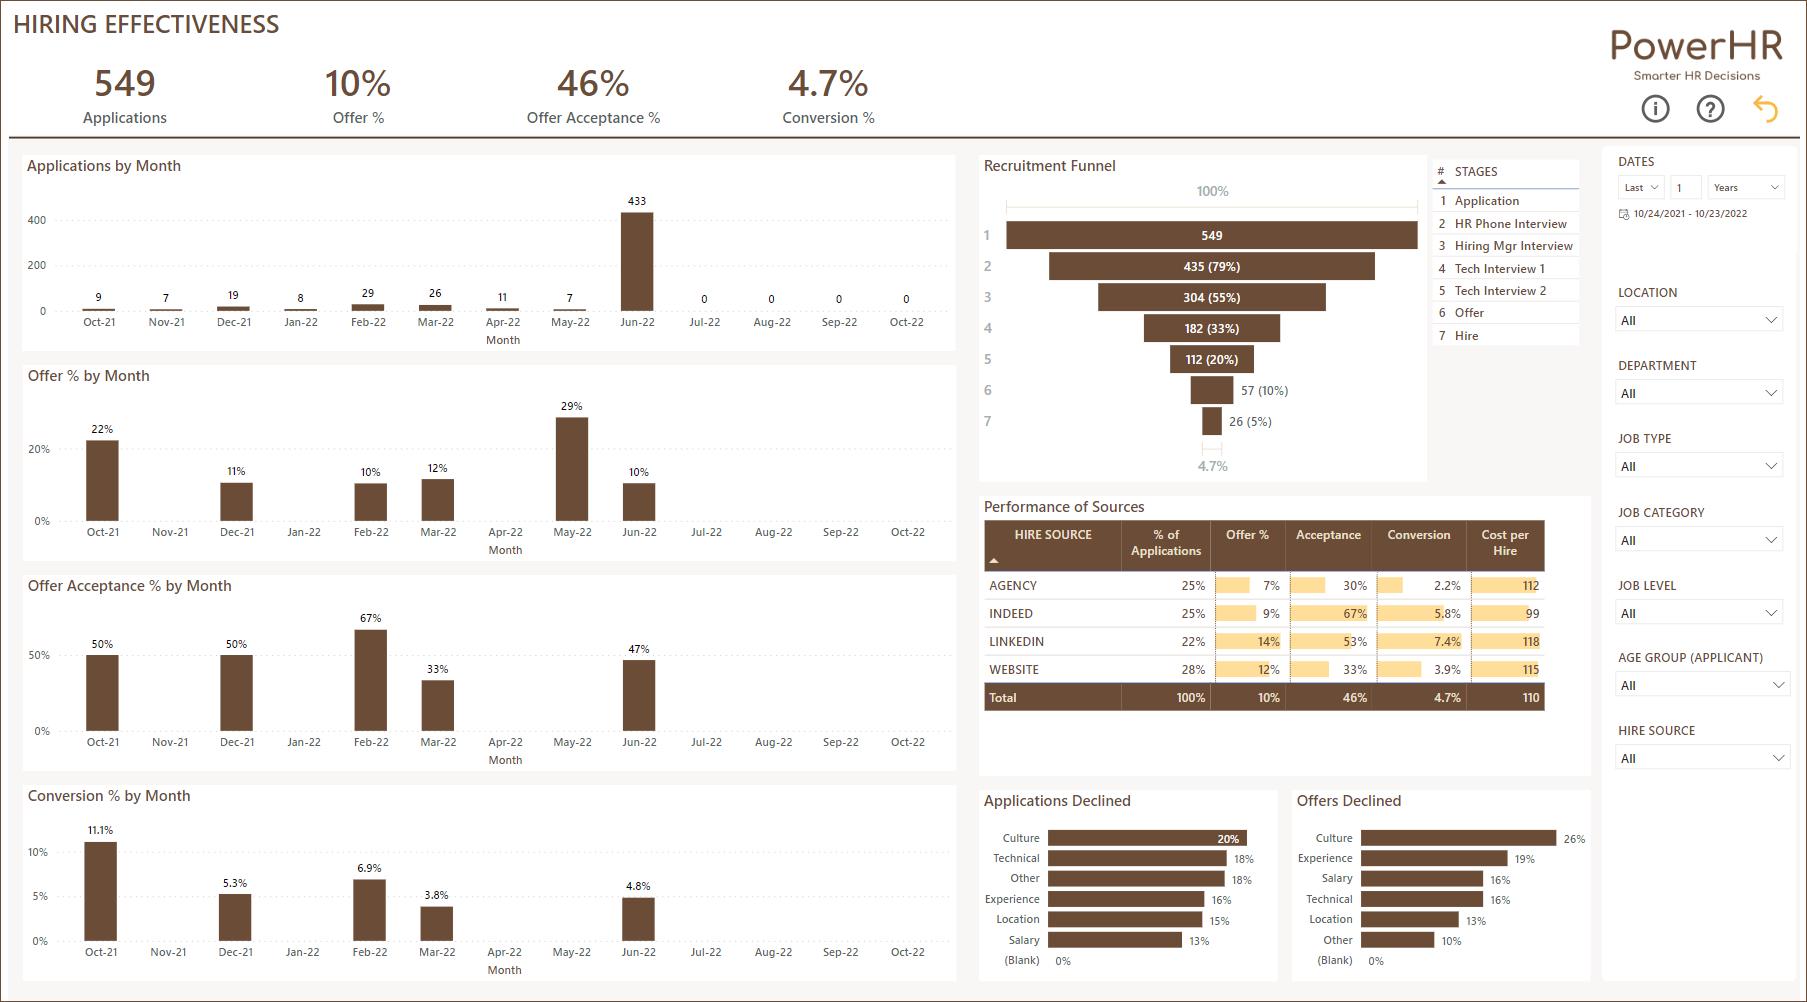
Measuring Recruitment Process’ Effectiveness
Effectiveness Metrics (Filling Open positions)
Let’s look at common measures of effectiveness in filling open positions.
Metric: Conversion % (Hires/Applications)
Conversion % can also be called as Selection % or Selection Ratio
Definition: % of Applications received that became accepted offers or hires
Calculation: [Number of Hires / Number of Applications received]
An alternative here would be ‘Applications per Hire’ metric which is calculated as (Applications/Hires). In our example of 5 hires out of 100 applications, it is 5% conversion rate and 20 Applications per hire. Both mean the same.

Conversion % or Selection % metric
Interpretation:
If this metric is higher, it indicates the fit of the applications to the job requirements. Candidate sourcing process is working well. Interviewing or selection process is working well. Offers given match candidates’ expectations.
A low conversion % could indicate either the candidate quality and fit are not up to the mark for us to select them or the candidates we select reject our offer.
While conversion % measures the start (application) to finish (hire) process, a key step in-between is the Offer step.
To better understand Conversion %, it can be broken down into 2 separate metrics – Offer % and Offer Acceptance %.
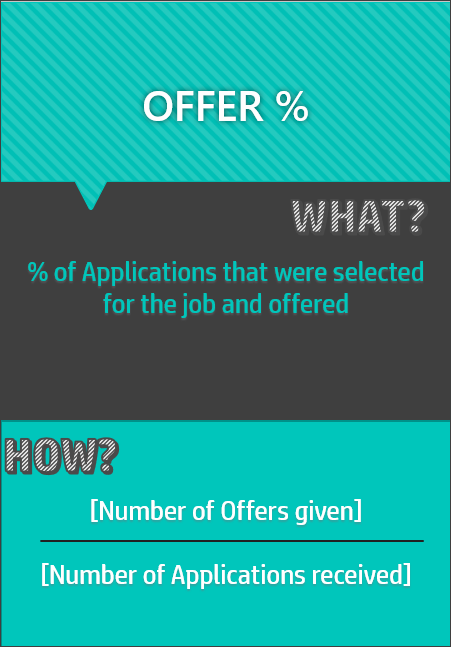
Metric: Offer %
Definition: % of Applications that were selected for the job and offered.
Calculation: [Number of Offers given / Number of Applications Received]
Recruitment Metrics - Offer %
Interpretation:
High Offer % could mean that you are finding good candidates from the application pool. You could be receiving fewer but good quality applications. If you stop receiving applications after a certain limit, then a high offer% could mean you don’t have to invite more applications since you find good candidates in a smaller pool.
Low Offer % indicates most candidates are not meeting the requirements.
Metric: Offer Acceptance %
Definition: % of offers given that were accepted by candidates.
Calculation: [Number of Accepted Offers / Number of Offers given]

Recruitment Metrics - Offer Acceptance %
Interpretation
If this metric is higher that indicates there is a good fit between selected candidates and the job offer. You are giving offers to candidates who are likely to accept.
You have already evaluated and addressed things that candidates want to know/address.
Candidate fit to job duties is great
The interview experience was very good and appreciated by candidate.
Good pay/benefits package
Culture fit.
If the metric is lower, you like the candidate, but candidate does not like the offer. Candidate might not have liked one or more of the following.
Job itself as candidate got to know more about the job duties during the interviews.
Recruitment/interview process itself – whether there were any mishaps or unprofessional actions.
Job salary/benefits package.
Culture of the company exhibited during the interviews.
Let’s move now to our second set of effectiveness metrics that measure ‘Quality of hires’.
Effectiveness Metrics (Quality of hires)
The quality of the chosen candidates can be somewhat visible during the interview process. However, the best measurement will be evaluating the performance or fitness of the employee to the company and role, based on the first 6 or 12 months of their tenure.
This can be done in a few ways. Some common measures are shown below. You don’t need all of them implemented in your company. You can choose the one(s) most appropriate for your company environment.
Metric: Early churn %
Definition: % of employees who exit the company within their early tenure (6 months or 1 year).
Calculation: [Number of Employees started during reporting period and left within 6 months / Number of Employees started during reporting period]

Recruitment Quality Metrics - Early Churn %
Interpretation
An employee leaving early in their tenure indicates the lack of fit of the candidate to the job/role.
If the exit is voluntary, that indicates the employee was not satisfied with the role. It is possible that something during onboarding could have gone wrong and the employee became dissatisfied.
If the exit is involuntary, the company has decided to let the employee go due to the lack of fit.
Note: If the employee leaves early, then we must incur all the costs again (recruiting costs, training costs, onboarding costs and lost production (due to an open seat) costs)
Metric: Manager Satisfaction %
Definition: % of new hires considered as satisfactory hire by managers
Calculation: [New Hires rated satisfactory by Managers / New Hires]

Recruitment Quality Metrics - Manager Satisfaction %
Interpretation
Hiring Managers indicating they are satisfied with the new hire is a good measure of quality of hire.
To accomplish this measure, a survey could be sent out to hiring managers requesting feedback on their new hire during the early tenure points (90 Day, 6 months, 1 year).
This is often a very short survey getting quick feedback from the managers.
Metric: First Year Performance Satisfaction %
Definition: % of new hires rated satisfactory during their first-year annual performance review
Calculation: [New Hires rated satisfactory in Performance Review/ New Hires]

Recruitment Quality Metrics - First-Year Performance %
Interpretation
Typically, one year is sufficient time to evaluate an employee’s performance and fit for the role. The first annual performance review of an employee could be used as a measurement for quality of hire.
If the performance review indicates the employee is a good fit, then the hiring process selected a good quality candidate.
Metric: Time to productivity
An alternative to satisfaction surveys would be measuring how quickly a new hire ramps up to expected productivity levels for that role.
Definition: Average number of days it took for new hires to get to expected productivity levels.
Calculation: [Sum of number of days taken to reach productivity of all new hires/Number of New Hires]

Recruitment Quality Metrics - Time to productivity
Interpretation
The shorter the time to productivity, the better it is for the company. The employee’s contribution to the company will start sooner and the company will start benefiting.
CAUTION: One thing to note with this average measure is that outliers (one or two employees having extreme time to productivity) can skew the result. We could measure median instead of Average in such scenarios.
Effectiveness vs Efficiency
High Conversion % and High quality of candidates represent an effective program. They indicate a good candidate sourcing process, interview process and overall recruitment program.
The effectiveness metrics will help us identify how to make the process more effective – getting right candidates into the funnel and improving the candidate-job fit.
However, is there a cost involved in bringing that effectiveness (cost of improving the sourcing process to bring the best candidates)? If so, is that cost too much?
Let’s take a simple example.
We have three different recruitment programs. All 3 achieve the same outcomes – 10 successful candidates hired with same high quality of candidates.
The highly effective recruitment program A (high conversion %) costs $50,000.
The moderately effective recruitment program B (moderate conversion %) costs $30,000.
Our least effective recruitment program C (lowest conversion %) costs $10,000.

Effectiveness vs Efficiency of Talent Acquisition Programs
Now, our program C may not be the most effective, but it is extremely efficient.
Let’s look at Efficiency metrics in more detail.
Efficiency Metrics
To remind us of the objective of a recruitment program,
A successful recruitment program aims to fill open positions with high quality candidates as quickly as possible with minimal cost.
We will look at efficiency in two dimensions - Speed and Cost.
Efficiency Measurement of Talent Acquisition Program
Speed of Recruitment
The faster we can hire, the faster we can fill an open position, the sooner the employee can contribute to the company’s bottom line and the lower the loss we incur due to the stoppage of work due to an open seat.
We can measure speed in a couple of different ways.

A simplified Recruiting process timeline or flow
Metric: Time to Fill
The metric that matters most is the time taken to fill an open position. This metric measures how quickly a position is filled from posting date to an employee filling that position at work.
Definition: Average time taken to fill an open position.
Calculation: [Total Days from Job Posted date to Join date]/[Number of Hires]

Recruiting Metrics - Time to Fill open positions
Interpretation
The higher this metric, the more the loss for the company due to an open seat. So, actions should always be taken to reduce the time it takes to fill.
Watch out for outliers as Averages can get skewed due to one or two outlier cases where it might have taken exceptionally long time to fill.

A recruiting process’ timeline expanded
This metric measures the complete window of time, and we can consider breaking this down to 3 individual periods. A very long Time to fill could be due to any of these 3 individual periods being long.
Time to Apply: Job Posted date to Application Received Date
Time to Hire: From the Application Received date to offer acceptance date (or hire date)
Hire to Join: From Hire date to Join Date
Metric: Time to Hire
This metric measures the speed of the hiring process once the candidate applies and enters your recruitment funnel.
It includes application review, interview scheduling, candidate selection, offering and acceptance.
This will be measured only based on hired candidates (not rejected ones).
Definition: Time from when applicant applied to the job until the date when the candidate accepts the offer.
Calculation: [Total Days from Application date to Hire date] / [Number of Hires]

Recruiting Metrics - Time to Hire
Interpretation
A high average time to hire indicates either the process has a lot of steps (interview stages) or there are some scheduling challenges to line up all the recruitment steps (interviews, internal reviews, selection meetings, offer generation and delivery) in a way to shorten the total hire time.
Watch out for outliers as Averages can get skewed due to one or two outlier cases where it might have taken exceptionally long time to hire. We could use Median instead of average in such scenarios.
Metric: Time from Hire to Join
This metric measures how quickly the offered candidate joined the company after accepting the offer.
It is important to note that the value generation for the company can start only after candidate joins work.
This will be measured only based on hired candidates (not rejected ones).
Definition: Time from when candidate accepts job until the date when the candidate joins work.
Calculation: [Total Days from Hire date to Join date] / [Number of Hires]

Recruiting Metrics - Time to Join
Interpretation
This will typically be the notice period that the candidate needs to provide to the previous employer. Having visibility to this metric will allow you to better plan and forecast your staffing.
Recruitment Cost
When it comes to measuring the cost of a recruitment program, it is important to consider all costs involved – candidate sourcing costs, agency costs, any software costs and costs involved in the interviewing process (for company and for candidate).
I would recommend also considering the time spent by all involved in the process. Time is money. If 6 employees are involved in the interview loop, they are all spending their time interviewing each candidate who reached that stage. So, if you bring in a lot of candidates for them, they must spend more time and that should be considered as a cost.
Metric: Cost per Hire
Definition: Average Cost involved in recruiting a candidate.
Calculation: [Hiring Cost / Number of Hires]

Recruiting Metrics - Cost per Hire
Interpretation
This measure measures how cost efficient the process is. The intent will be to lower the cost per hire while maintaining the expected good quality of candidates.
Operational Metrics
The strategic metrics we discussed so far are typically reviewed and acted upon monthly.
There are some other things that need to be looked at daily for operational purposes. Let’s look at those now.
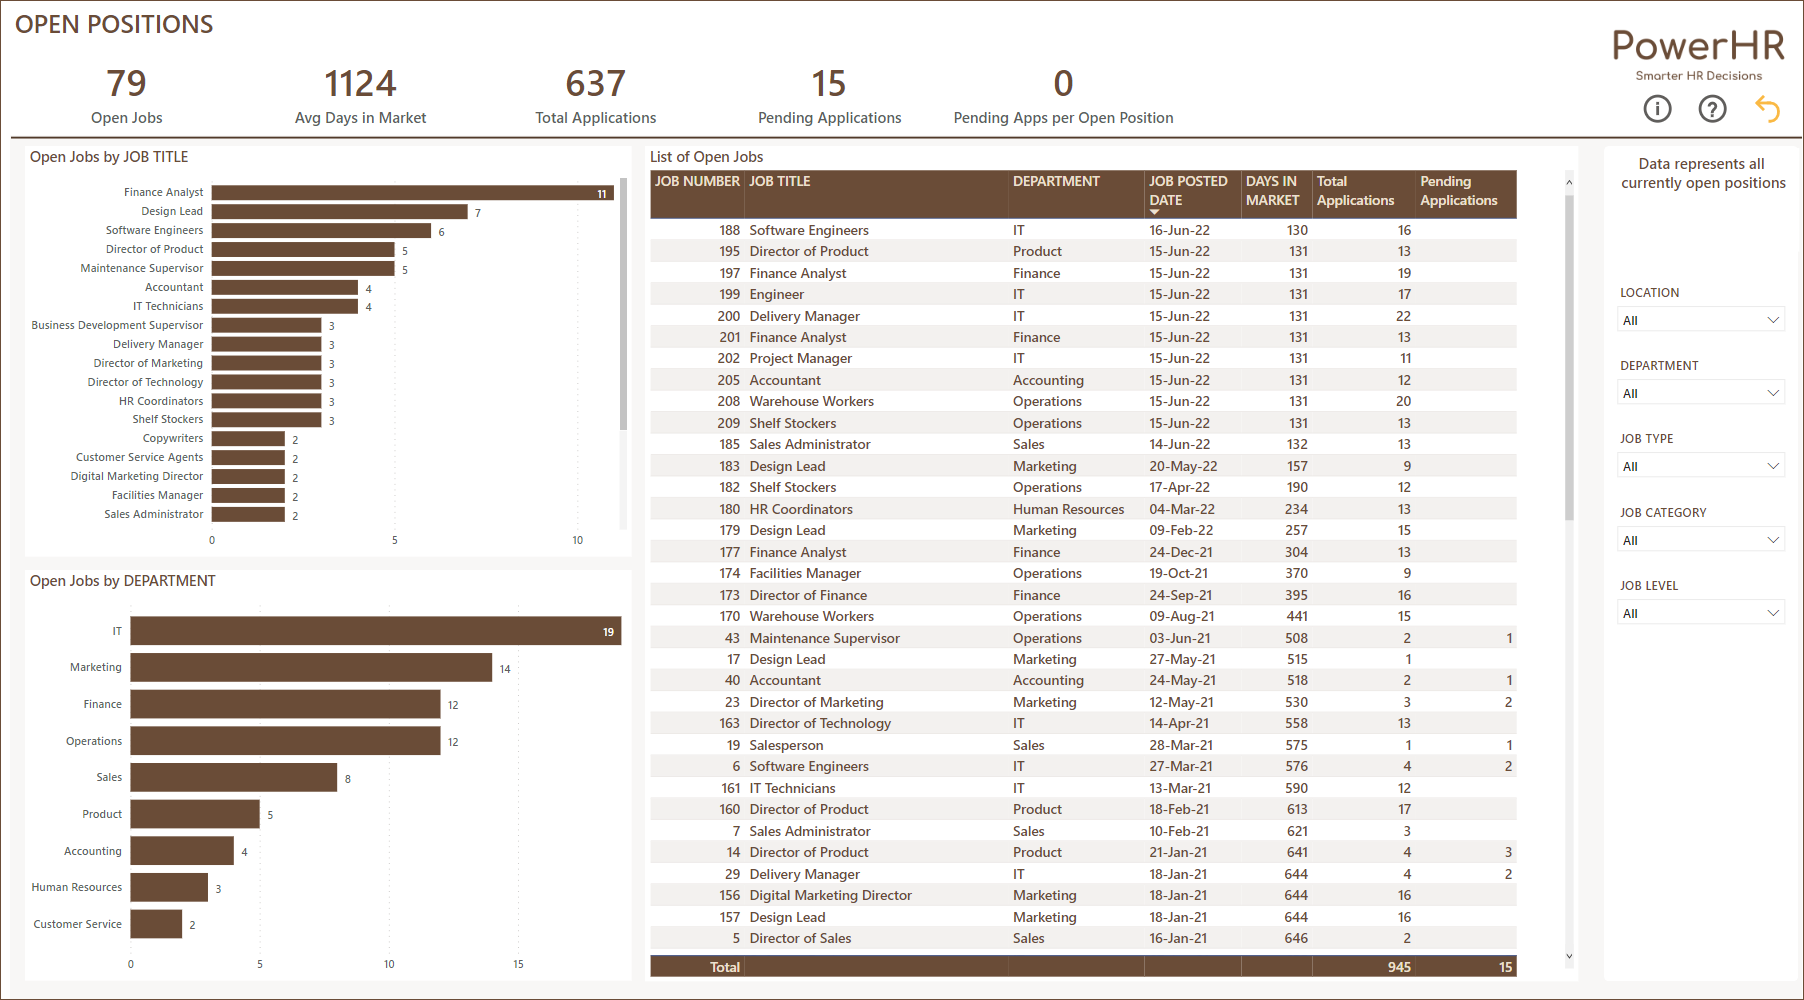
For operational purposes, one needs quick access to data on open jobs.

Open Jobs Report
Such an Open Jobs report should include the following metrics, in addition to the actual list of open jobs.

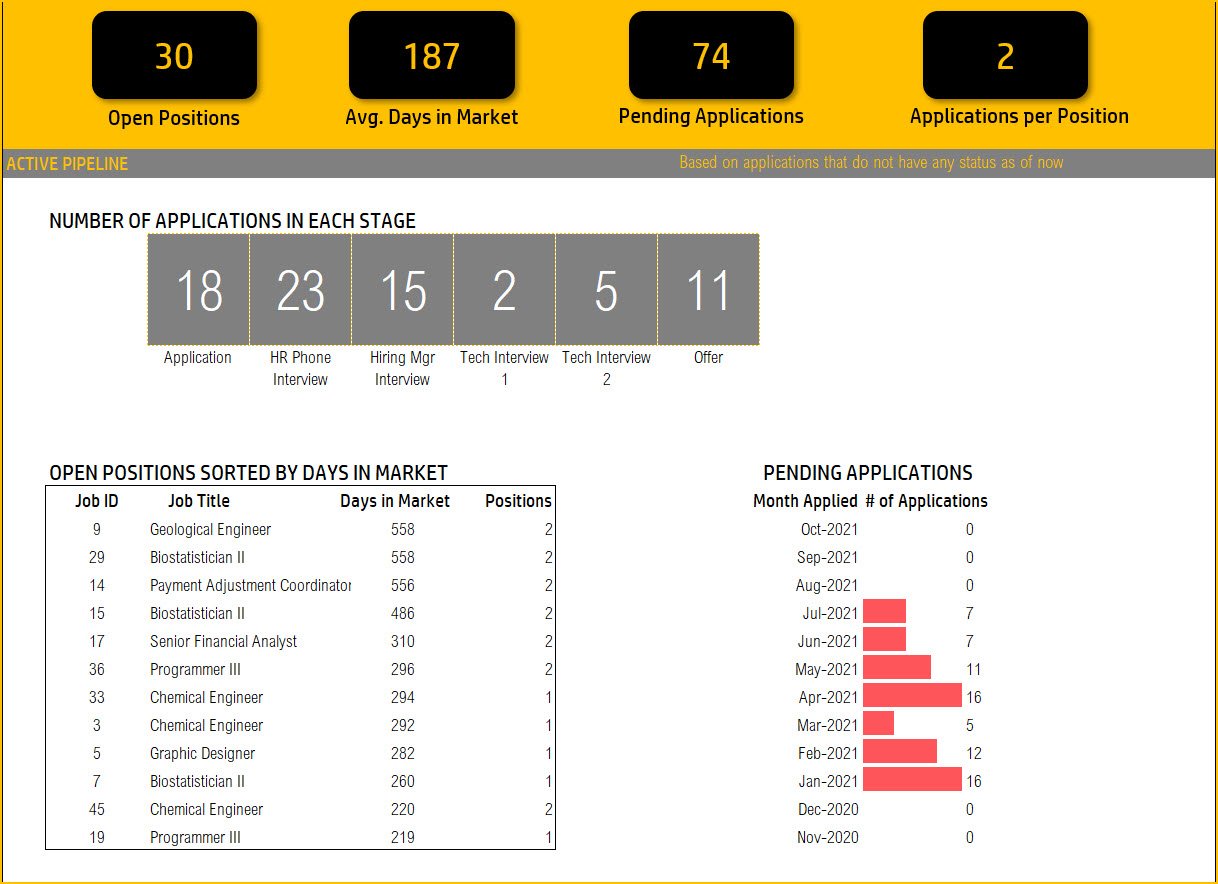
Operational Metrics for Recruitment Program
Open Positions: Number of Positions that are still not filled as of now
Avg. Days in Market: Average number of days from Job Posted date to Today for open positions
Pending Applications: Number of Applications where the decision has not been taken
Applications per position: Pending Applications divided by Number of Open positions
The operational metrics give quick evaluation of the magnitude of the open positions, how old the jobs are, and volume of the active pipeline of candidates.
This ends our discussion on key recruitment metrics.

Recruiting Metrics List
Analysis & Actions
Having overall metrics will not take us very far.
We need to analyze the metrics by segmenting on key dimensions and also view the trending.

Why Segmentation?
I will provide below, specific type of analyses you can do to drive specific decisions to improve your recruitment process.
Recruitment Funnel
As we are measuring the candidate flow through our recruitment process, the Offer % metric measures directly what % of candidates reached the Offer Stage. That is an important stage.
A more in-depth look into effectiveness requires not only measuring the Offer or Acceptance stage. It requires close analysis of all the recruitment stages.
If the Offer % is low, it means we are not finding candidates worthy of giving the offer. Why?
The candidates go through other stages before they get offered. So, if we want to improve the Offer %, we need to also study the other stages. This is why a recruitment funnel visualization is needed.

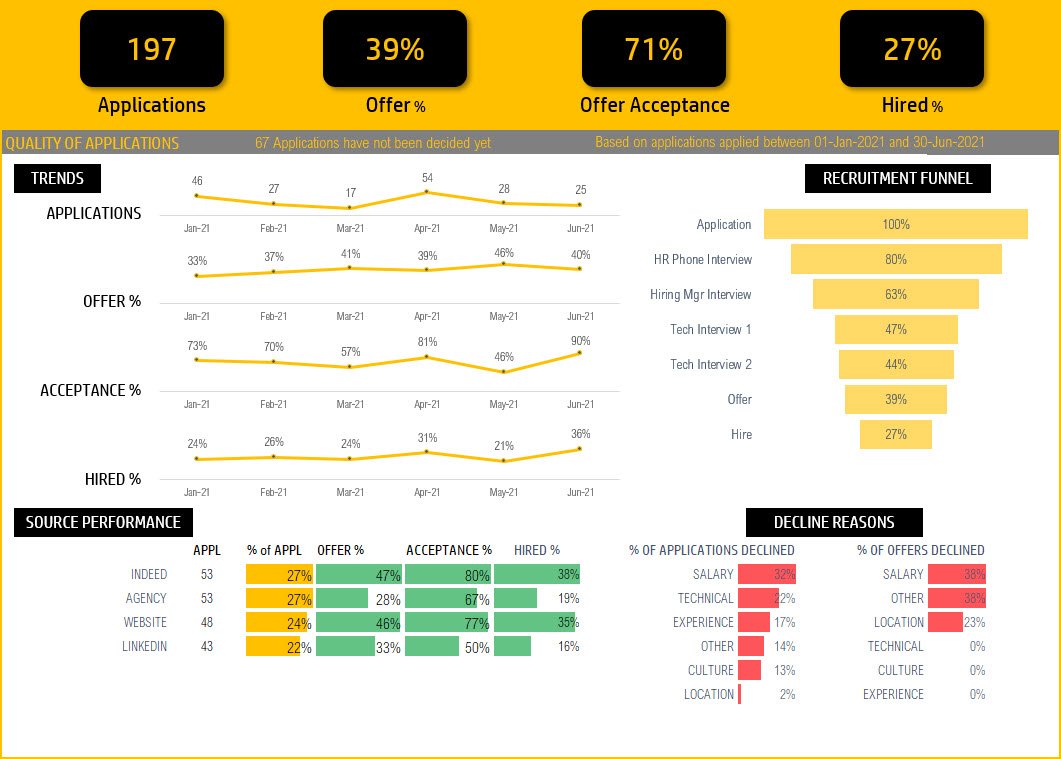
Recruiting Funnel
The purpose of the funnel is to inform us in which stage the candidates are dropping off.
In the above example funnel, 80% of candidates are moving on from Application Stage to Phone interview stage. 63% of all candidates (who started with application) reached the Hiring Manager interview.
Actions/Decisions
Study the funnel drop-offs and analyze reasons why the drop-offs are happening. Depending on what is causing the drop-off, take actions accordingly.
A couple of examples to illustrate action you can take
Source better candidates with technical skills (if candidates are dropping off in technical interview stage). This may require a change in job description and also recruiters’ search process.
Re-evaluate job salary if candidates drop-off in first stage after getting to know the salary.
To help us identify reasons for drop-off, we need to capture the decline reasons, which will be our next analysis module.
Decline Reasons
There are two areas of declines that can happen.
The company declining the candidates during the recruitment process.
Candidates who received offers decline the offer given.
It is important to know the reasons for both these decline situations.

Application and Offer Decline Reasons
Actions/Decisions
By knowing why company is declining candidates, we can improve our recruitment stages so that such non-compatible candidates can be removed from our funnel as early as possible. This will save the company time and money.
By knowing why candidates are rejecting offers, we can either change our offer, our recruitment process, or our job description to ensure that rejections are minimized. This will save the company time and money.
Sourcing Channel Analysis
Companies may receive applications from multiple channels or sources. It is important to figure out what channel mix strategy is ideal to bring in good quality candidates at the least cost possible.
To begin with, we need to know how important currently each source is. By knowing ‘% of Hired’ metric we understand the contribution of each source.

Sourcing Channel Contribution to Successful Hires
In the above example, Indeed and Website bring 70% of all successful candidates.
Then, we need to evaluate the effectiveness of the sources by comparing effectiveness and efficiency metrics of the sourcing channels.
Actions/Decisions
This information will help decide the investment choices when it comes to sourcing channels. We should invest more money in channels that bring higher quality candidates at a lower cost.

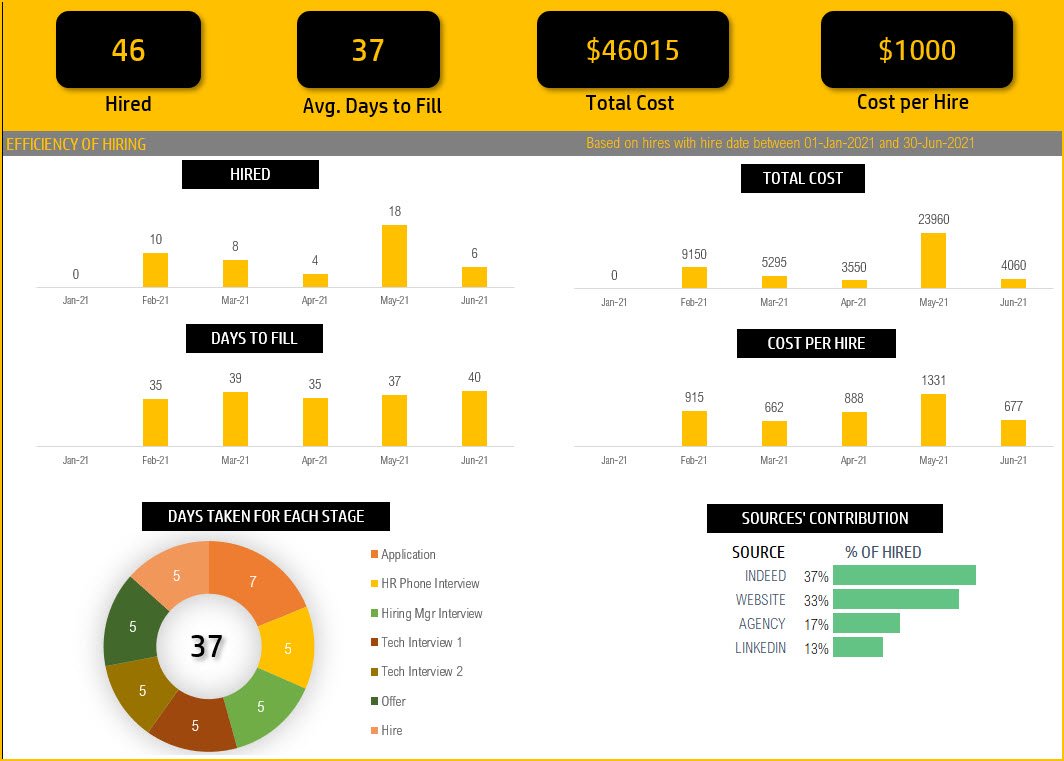
Hiring Source Channel Performance Analysis
Closer look at Speed
To reduce the time taken to fill a role, we need to identify the bottlenecks, if any, in the process.

Time taken by each Recruitment Stage - Analysis
Actions/Decisions
If a certain stage takes a long time, we can take some actions to address the reasons for the delay.
Trending & Targets
Measuring the process effectiveness and efficiency for a point of time (example: for a month) is good. But sometimes more important is to measure the trend of the metrics over time.

HR Recruiting Metric Trends Analysis
Actions/Decisions
Once you know your baseline, you can set targets to improve month over month, and monitor whether you are improving. Hence a good recruitment report should have visibility to metrics’ trends. Monthly is typically a good timeframe to measure.
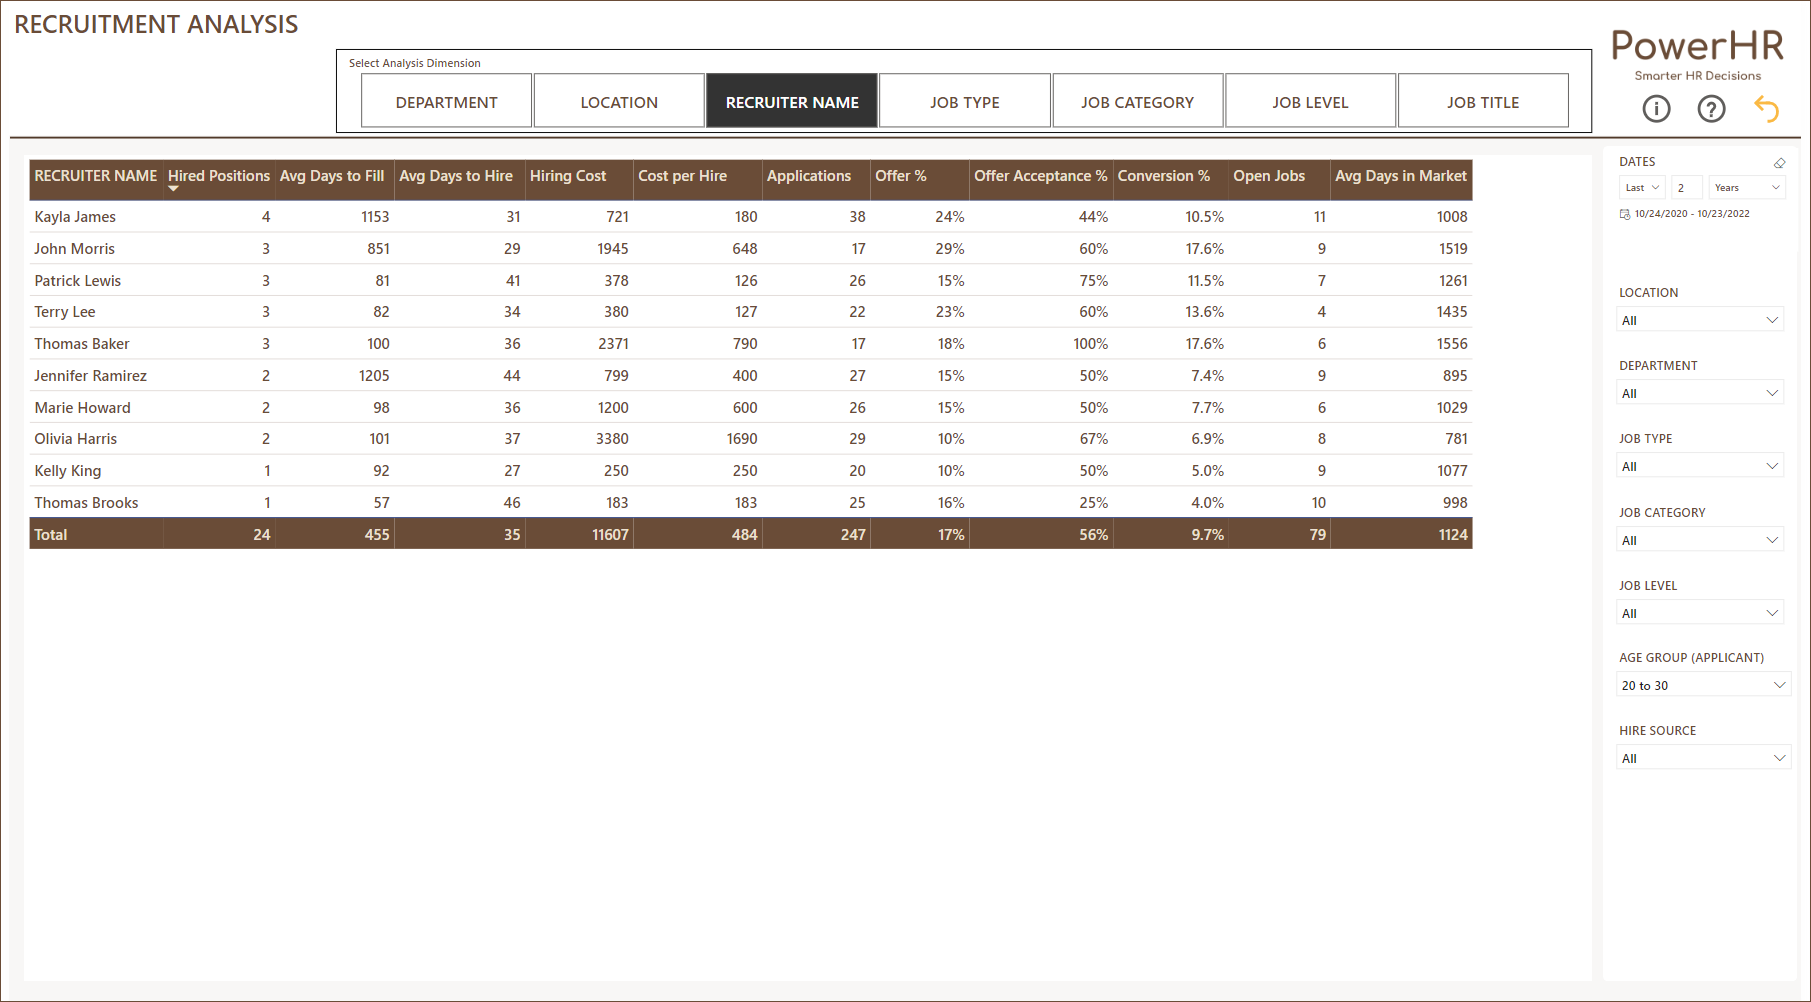
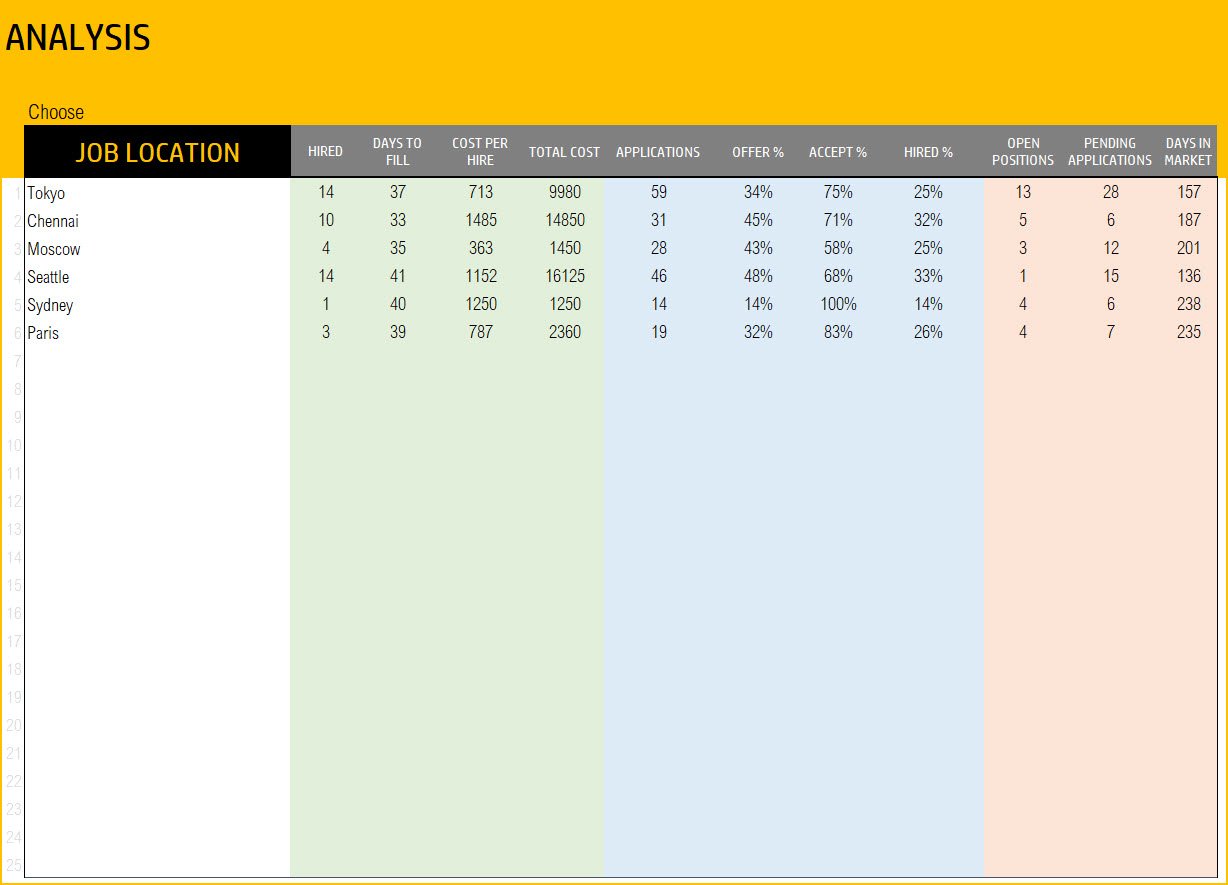
Best practice Analysis
A very important part of reporting is to identify best practices – what is working well and what is not working well. This allows you to take actions on what is not working well and learn from what is working well and apply to rest of the areas.
Actions/Decisions
For example, analyzing the metrics by recruiter helps find recruiters who are doing amazing on the metrics. One can talk to those recruiters and document why and how they have been successful. Share the tips to the rest of the recruiters. Similarly, talk to the recruiters whose metrics are not great and learn their challenges and address their needs.

Analysis to identify best Recruitment practices
This can be done by department or location or other segments too.
Note that what works well can be different for different types of jobs – full-time vs part-time, entry level job vs executive level, etc.
So, always select your data and ensure that the changes you could be implementing are applicable to all jobs in that chosen segment.
Active Pipeline
From an operational point of view, access to active pipeline of candidates by Stage is useful.

Active Pipeline of Candidates
Actions/Decisions
Knowing where bulk of the candidates are currently in the pipeline, HR leader can assign necessary resources to the right stage to expedite the process as needed.
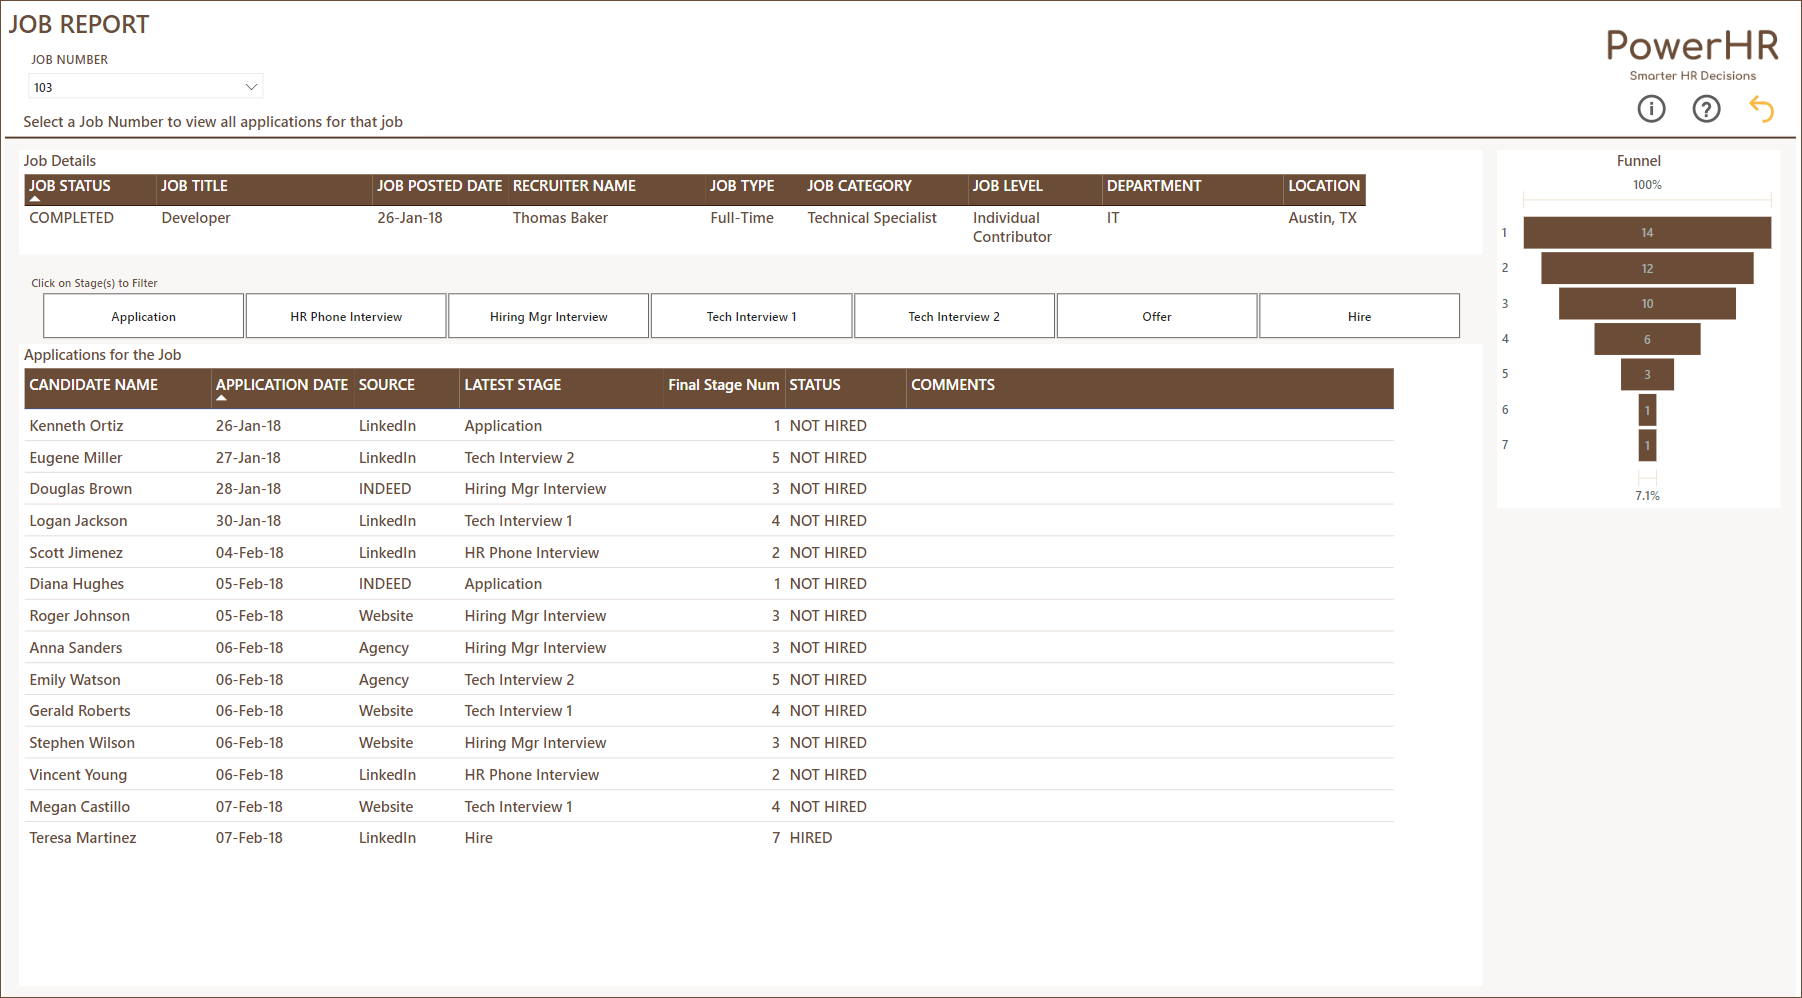
Job Detail Reporting
When it comes to reviewing a specific job’s pipeline, it is useful to have visibility to all candidates who applied to a specific job, their status in the pipeline and any comments from recruiters.
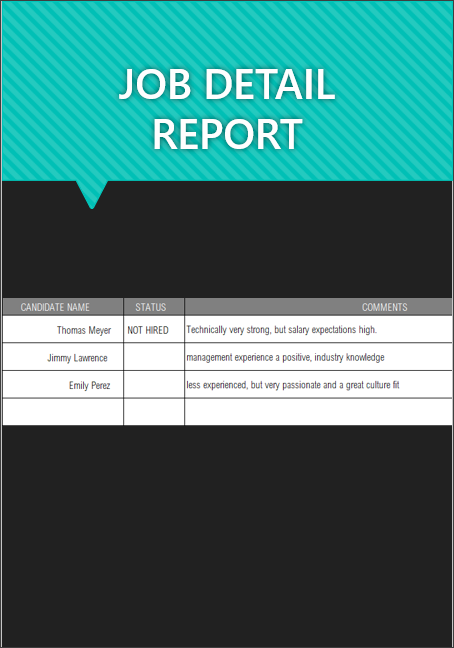
Detailed report on specific job
Now that we have covered common analyses one can do to optimize the talent acquisition program, let’s discuss some common features that should be part of any reporting platform.
Blueprint for a successful reporting platform
To implement a successful platform to measure and optimize recruitment, the following are important requirements.
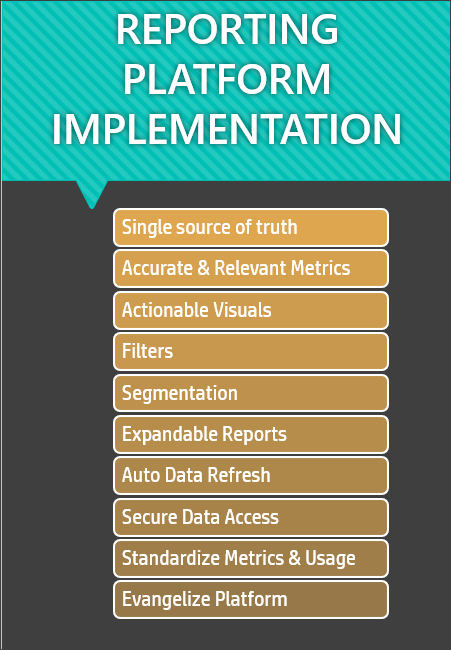
Blueprint for implementing successful reporting platform
‘Single source of truth’ accurate data
Required data for reporting should not be maintained on multiple systems. Even if the source data comes from multiple systems, they should be brought into one layer that is used for reporting purposes. This is important for all users to have same results in their reports.
Accurate and Relevant Metrics
The relevant metrics should be readily available in reporting with option to create new metrics easily.
Actionable visuals
The data visualization used should be easy to understand and take actions or decisions.
Filters
Often we need to define the context of our reporting and analysis by narrowing it down to a specific department or location or any such attribute. Filters are crucial for this capability.
Segmentation (slice and dice)
Typically a good reporting platform will allow customizing the segmentation dimension by drag-and-drop.
Expandable Reports
Out-of-the box reports should be meaningful and creating new reports should be easy
Automatic Data refresh
Data in Reports should be up to date according to the required refresh frequency.
Secure Data Access
Data Security is paramount when it comes to people data. Access should be given with utmost care. Only users who should have access to a specific report/data should have the access.
Standardize Metrics and Usage
It is important to arrive at a standard naming conventions of metrics, their definitions and usage to take decisions.
Evangelizing Platform
Effort should be made to create awareness of the platform and its benefits with all the users. Training should be given about the terminology and application of the reports and metrics.
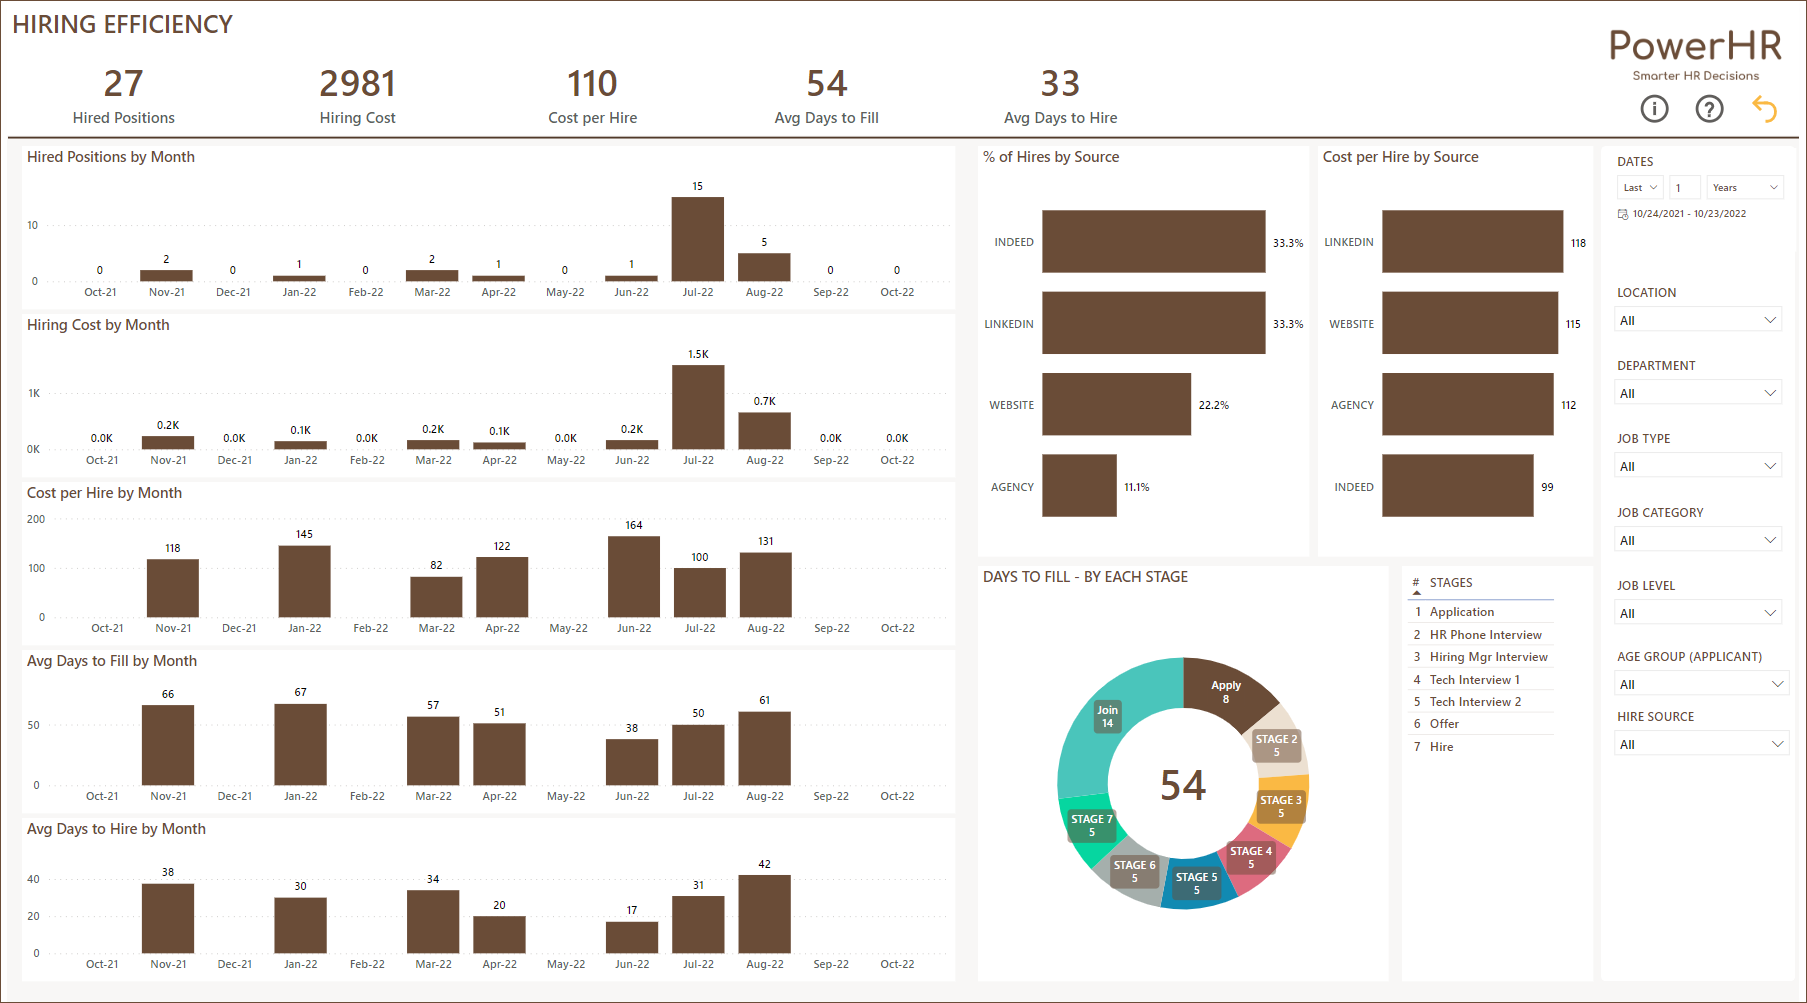
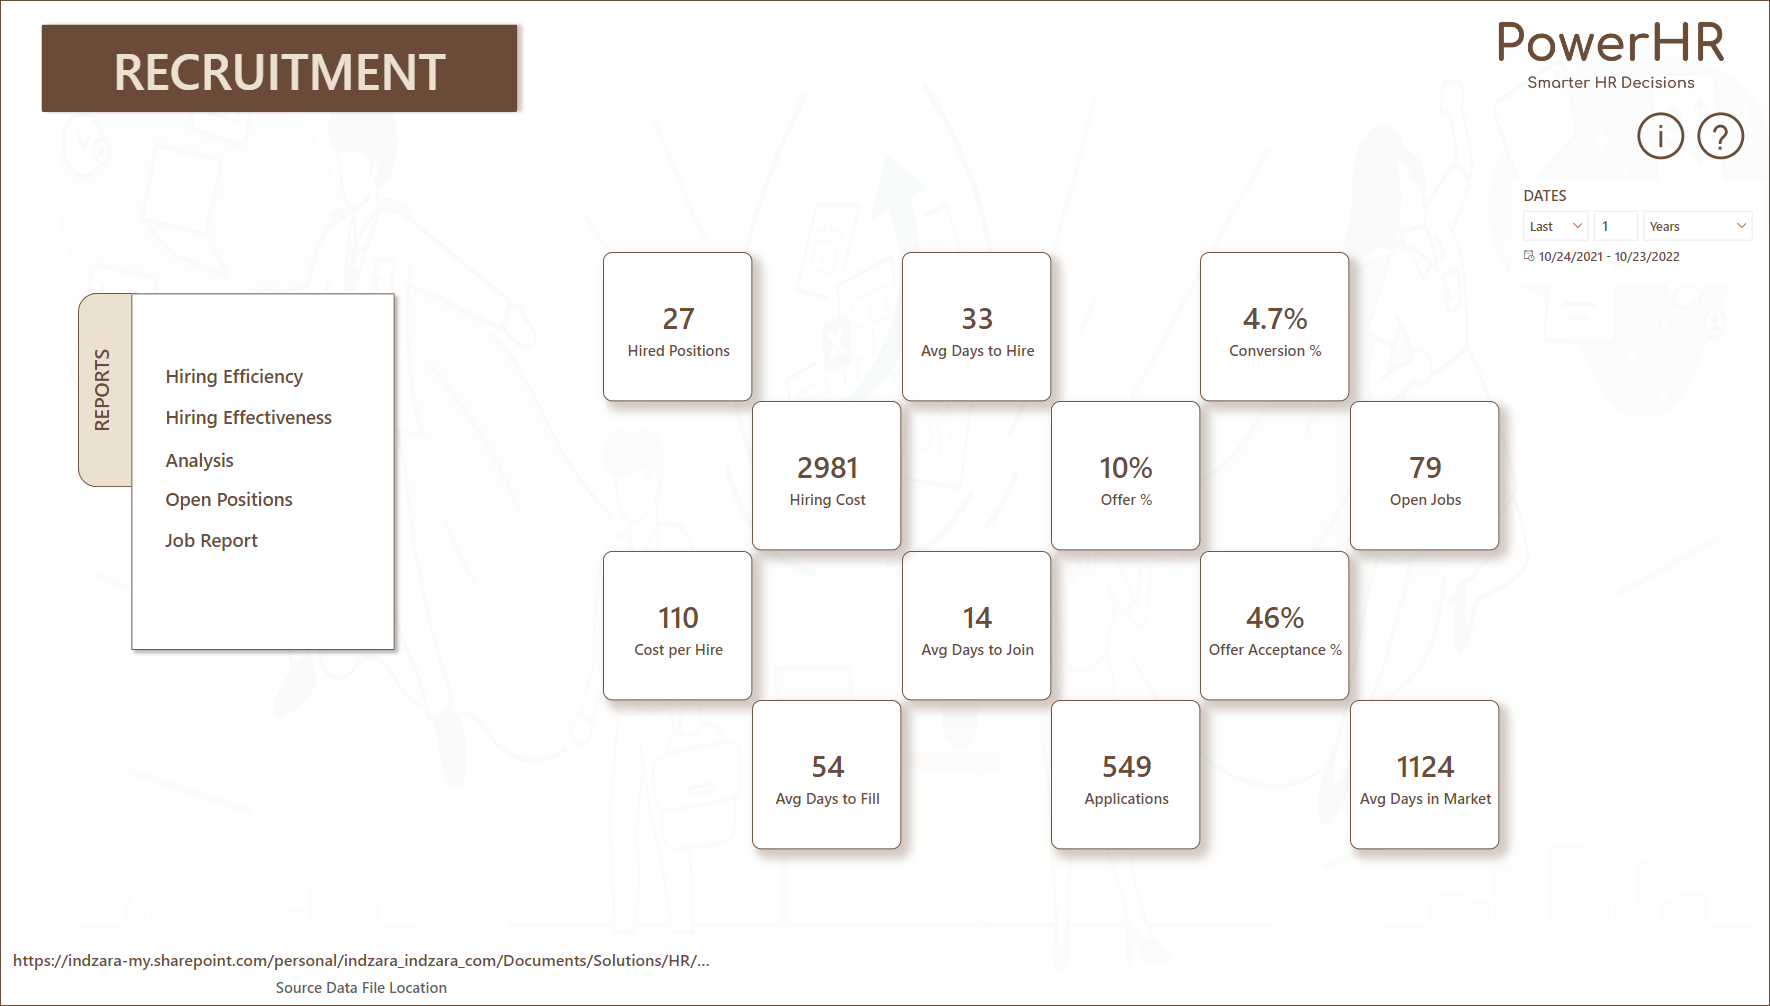
Sample Reports and Dashboards
In this section, I will provide screenshots of recruitment reports and dashboards we have developed.
They are available in 3 different platforms – Microsoft Excel, Google Sheets and Power BI.

3 Reporting Platforms
Gallery
HR Reporting Tools
HR Product Bundles
The following are links to our product bundles that provide reports and dashboards that cover all aspects of HR including recruitment.

Power HR - Power BI
HR Excel Superpower

HR Sheets Superpower
Individual Recruitment Dashboard Templates
If you are looking for dashboards that focus only on recruitment, you can get our individual templates using the links below.

Recruitment Manager Excel Template
Recruitment Dashboards and Reports built in Microsoft Excel

Recruitment Manager Google Sheets Template
Compatible with Google Sheets

Recruitment Dashboard Power BI Template
Enter your input data in Excel and visualize reports in Power BI Desktop