Headcount

HR Metric - Headcount - Count of Employees
What (Definition)
Headcount metric represents the count of employed people or active employees in a company at any given point of time.
Why (Benefits)
It helps answer the basic questions like:
How many employees are there in the company?
How many employees are in the HR department?
The benefits of having this metric are below:
Operational: A lot of operational planning and execution, such as company events, employee group activities and more depend on knowing exactly how many employees are in each team and overall.
Financial: A company can plan only by knowing how many employees they currently have and how many they expect to have in future. This includes budget allocation, developing employee benefits programs, employee incentives, etc.
Legal & Compliance: Headcount is also needed for legal purposes. Local government rules and regulations may change depending on the size of the company, which can be measured by the number of employees.
Base for Other metrics: In HR analytics, Headcount becomes a component of several compound metrics such as Revenue per Employee, Average Salary per Employee, etc.
How (Calculation)
Count of Active Employees at any given time.
Counting the number of employees seems straightforward, however there are a few things that could make it tricky.
You should consider ‘Employee status’ to only count employees who are currently employed and exclude employees who have already left the company.
If an employee has given notice that he/she will leave in the immediate future, you would still count that employee until the day of exit/termination of the employee.
When plotting the trend over time, we need to calculate this count of employees as of each point in time (Let’s say end of each month). This will require knowing the status of the employee exactly at the end of each month.
What method we use to calculate current headcount will depend on the way data is structured in our data source. Let’s review a few common data structures.
Please note that a combination of these scenarios can also happen in real-life corporate data. The concepts provided below will be useful to address those scenarios.
Scenario 1 - Dataset has only active Employees
This is the most straightforward scenario. The source data has only active employees. They have already removed
Employees who have left the company
Employees who have been hired but not yet joined the company
Employees who have given notice and are about to leave the company.

Headcount calculation - Count of Employees - Only Active Employees in Dataset
Calculation becomes quite simple, as we have to just count the number of rows or records in our data. Here, in the example, there are 10 rows. So, current headcount is 10.
Scenario 2 - Dataset has both active and future employees
In this scenario, they have included employees who are about to join the company. Those employees will have a Start Date in future.
Today’s date is Mar 16, 2023. Any employee with date after March 16, 2023 will be excluded from Current headcount calculation.
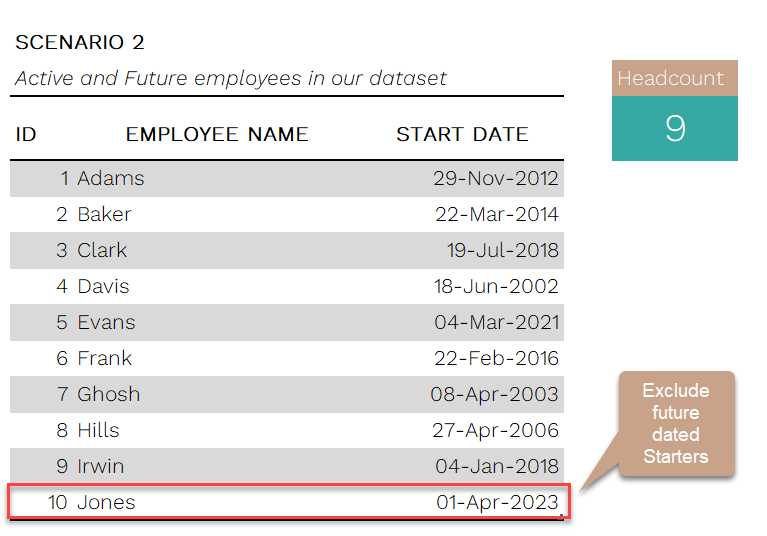
Headcount calculation - Scenario 2 - Active and Future Employees in data
In the above example, Jones will be excluded. Headcount will be 9.
Scenario 3 - Dataset has a status indicator
Sometimes, your source data may have a column which already displays whether the employee is active or not.

Headcount calculation - Scenario 3 - Status indicator column.png
In the example above, the Status column has ‘Active’ or ‘Inactive’ values. In your data, the values could be different. For example, it could be ‘Yes’ or ‘No’. The concept remains the same.
We want to exclude employee records which have status ‘Inactive’ when we calculate headcount.
In this sample data, headcount is 8.
Scenario 4 - Joiners and Leavers in 2 different datasets
In this scenario, we will have two datasets - one with list of all employees who joined the company, and the other with the list of all employees who have left the company.

Headcount calculation - Scenario 4 - Joiners and Leavers in Different Datasets
We have to count the leavers and then subtract from the joiners.
In this sample data, 10 joiners - 2 leavers = 8 current headcount.
Scenario 5 - Start Date and Exit Date in Data
In this scenario, we will have one dataset of list of employees with both Start Date and Exit date (for employees who left).

Headcount calculation - Scenario 5 - Start Date and Exit Date in Data
In this scenario we have to exclude employees who have exit date in the past.
Subtracting 2 employees with Exit dates in the past, we get 8 active employees.
Get automated HR metrics for your company with our templates
(Available in 3 platforms: Microsoft Power BI, Google Sheets or Microsoft Excel)


Related HR metrics


Now it’s your turn.
Please share your observations (in comments below) on how the employee data is structured in your company’s data sources. How do you calculate headcount? I look forward to learning from you.